Design model of information system of health monitoring of young studens
Фотографии:

ˑ:
The state of health of young students is an acute problem for it concerns health of the future generations and state strategical grounds. The analysis of the correlation of single health indices, providing for assessment of cardiorespiratory work, basic motor qualities, way of life and efficient work of immune system, promotes the capacities for obtaining the integrated index of health level [1-4].
The problem of organization of the effective system of health monitoring of multiple subjects is usually settled by designing a computer information system. The design of computer information systems is to be based on modern information technologies and selection of the easiest interface for users with weak knowledge in the field of information science [5-9].
The purpose of the study was to design a computer information system for the integrated health assessment of young students.
The research methods involved: analysis of modern information technologies and selection of the simplest interface for users who can be short of deep knowledge in the field of information science.
The works on the design of the information system of health monitoring based on the principles of prenosological diagnosis of students of the branch of Kuban state university in Slavyansk-na-Kubani served the sources of research.
Results and discussion. The data of the health level monitoring of the subjects was processed using the designed computer information system of integrated health assessment in compliance with the model of V.I. Belov [1]. The accepted system-related preconditions included:
– information system should be based on one of standard database models, that could ensure a comparatively easy data conversion from the used format to other database and file formats;
– ensuring free data access at most, including large number of users;
– providing minimal information security level, file integrity assessment, input and data editing errors check (hereinafter this condition can be intensified in next system versions).
– designing a simple enough and efficient system interface that serves the main user’s goals and does not need much time to learn.
To make these conditions work it was necessary to select the easiest, standard and intuitive methods of interface organization with the designed interface circuit that can be redesigned and modified.
In compliance with the set goal the program solutions and information technologies were as follows:
1. The extended hypertext format (XML technology) was chosen as a database technology. This is one of the most wide-spread technologies in the modern practice of design of information systems, providing ample opportunities for web publishing of the database. The advantage of this technology is the widespread occurrence of conversion means of the data in this format among various program systems, including modern database management systems (DBMS), desktop apps etc. The simple text data presentation format promotes an easy design of personal webware for XML files with no need to use special database access technologies.
2. The HTML hypertext Markup Language was chosen as the format for the report files of the information system, which enables the lack of the need to design a print engine within the project. For example, the HTML file can be easily converted to an electronic document of the word processor similar to MS Word. On the other hand, report files can be published in the Internet, ensuring an easy and effective access to them, including for large number of users. Then the designed information system can serve the basis for design of the Web-server Internet version.
3. The free software Turbo Delphi was chosen as a development tool for the system utilities. Turbo Delphi has enough to implement the important subsystems of the information system.
Since the health data of the subjects being processed has over 20 parameters, formation of the unified table of the database is called nonoptimal. The data are saved in 3 related tables (tables of health level, optimal physical loading, adaptive potential). The data are entered in the form of a table and 2 forms, that need one of the variants to be chosen in every parameter. The second variant of data input is provided by the automated control of the input data.
HTML file are used as reports and contain the results of calculations in the form of health level tables, optimal physical loading, adaptive potential and in the form of graphic charts of these data.
The designed variant of the project of the information system contains the executable module of the project and a file set of the database in the XML format.
The project environment interface represents a system of 5 correlated forms. Health level table is the main project form:
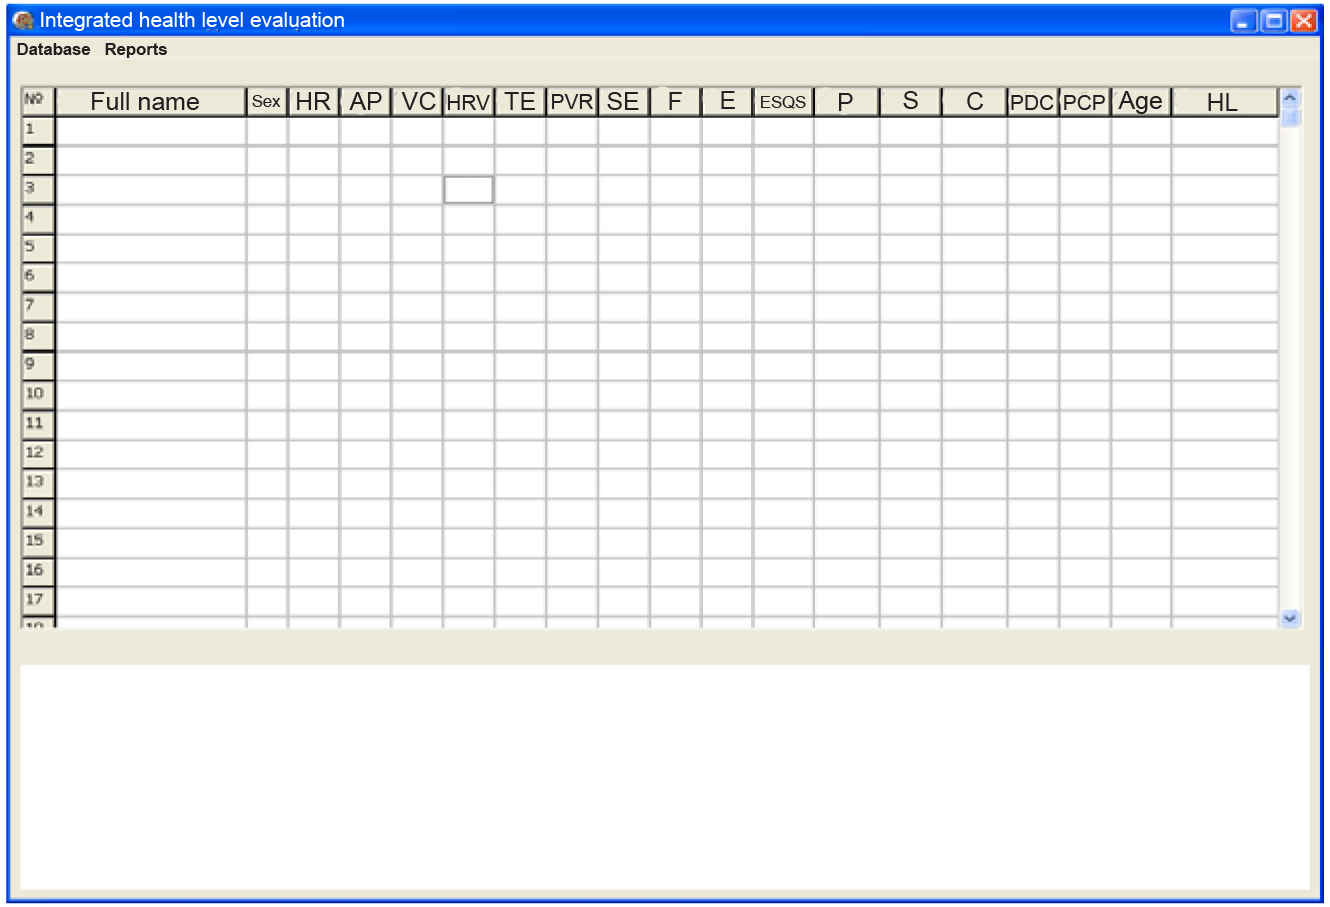
HR (heart rate)
AP (arterial pressure)
VC (vital capacity)
HRV (heart rate variability)
TE (Total endurance)
PVR (pulmonary vascular resistance)
SE (strength endurance)
F (flexibility)
E (Experience)
ESQS (Energy supply quality systems)
p (Prison)
S (Smoking)
A (Alcohol)
C (Consumption)
PDC (Preliminary Detention Cell)
PCP (petrochemical plant)
HL (Health Level)
The table displays the subjects’ data in 14 parameters and has a field to output health level calculations. The data can be entered directly in the table, but it is better to use the assistant form of data input to ensure their monitoring:

The assistant shape contributes to data input and editing by selecting one of possible variants. Such a data editing organization ensures their stricter monitoring. The maximal number of records in the table is 150, thus the data are better to be divided into parts (by groups, courses, forms etc.). It makes sense to do the graphic presentation of the data only for data groupings up to 30. If more records are used, the charts are not so visual.
A shortcut menu (accessed with a click of the right mouse button in the table) to access an assistant shape, for autofill (simultaneously with the calculation) of the health level field:
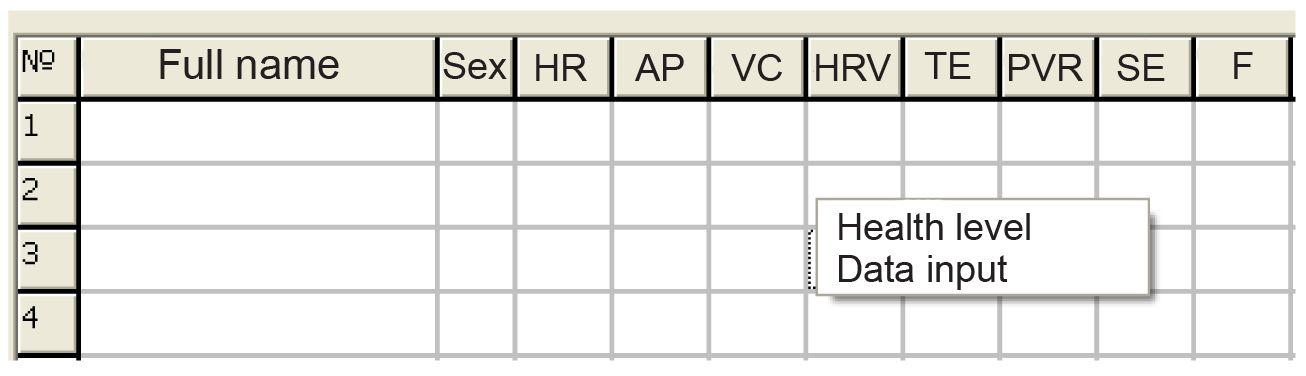
HR (heart rate)
AP (arterial pressure)
VC (vital capacity)
HRV (heart rate variability)
TE (Total endurance)
PVR (pulmonary vascular resistance)
SE (strength endurance)
F (flexibility)
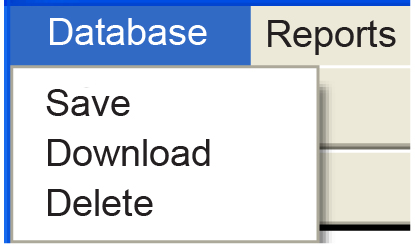
The main menu of the form of the health level table has 2 dropdown submenus – “Databases” and “Reports”. The first part of the menu serves for selection of action with the whole health level table. The options are: save in XML file, download from XML file or delete all:
The “reports” submenu is used to jump to related tables of optimal physical loading and adaptive potential:
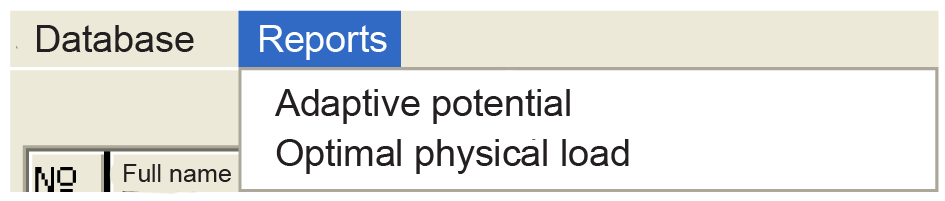
Each of these tables has its form. The form of the optimal physical loading is as follows:
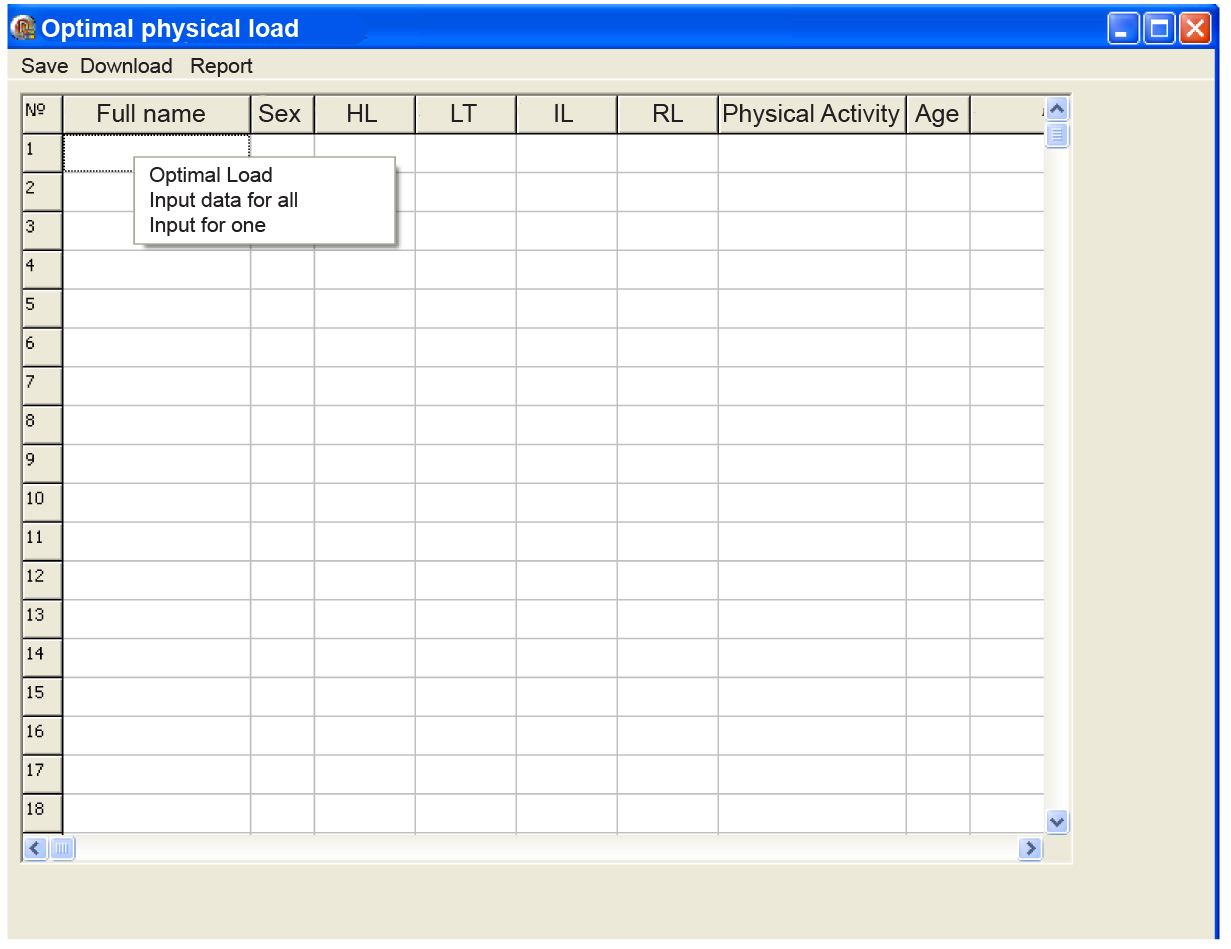
HL (Health level)
LT (Long-term Loading)
IL (Interval Loading)
RL (Regular Loading)
PA (Physical Activity)
The common fields (№, Full name, Sex, Health level, Age) are autosaved from the health level table. Other fields can be filled using filling forms that are obtained in the table shortcut menu. Organization of these forms is similar to the data input form for the health level table. The forms contribute to filling the data individually for one record or automatically for the whole table (or for one of the fields). After the data input the whole table can be saved in an XML file. The table that has been similarly saved in an XML file can be re-downloaded. The optimal physical loading is calculated automatically and filled when choosing an item of the drop-down submenu of the table.
The Report item of the main menu of the optimal physical loading form provides for coming to the assistant form of a report set-up:

The type of result in the HTML form is shown in the upper part of the form, while health level and optimal loading charts are displayed in turns in the lower part of the form. To form them one is to choose a relevant item in the upper menu of the form. After the checkup of correct formation the item “save” is selected in the menu for final saving of the result in the HTML file.
The designed information program displays the state of health and physical activity personally in first-year students of the physical education department and first-year students of social and economic department of the branch of Kuban state university in Slavyansk-na-Kubani. Insufficient physical activity is marked during the examination of 2-year students of the social and economic department.
The program is applied to monitor correction of health level and physical activity, accessible and easy to use in estimation of students’ health.
Conclusion. The health level monitoring organized using the designed information system promotes control of the variance of the quantitative change of health level – the generalized integrative index, representing a coordinate system on the universal scale of possible health estimates.
References
- Belov, V.I. Valeology: health, youth, beauty, longevity / V.I. Belov, F.F. Mikhailovich. – Moscow: Medra communications Ltd, 1999. – 663 P. (In Russian)
- Gapanyuk, Yu.E. The study and design of the model, methodology and means of creation of automated study guides with the use of XML technologies: abstract of Ph.D. thesis. – Moscow: 2006. – 15 P. (In Russian)
- Gasparyan, S.A. Automated information system of health monitoring of the population (department of medical cybernetics and information science, Russian state medical university) / S.A. Gasparyan, T.V. Zarubina, S.S. Belonosov et al. // Zdravookharanenie. – 2003. – № 10. – P. 167–172. (In Russian)
- Izbachkov, Yu.S. Information systems / Yu.S. Izbachkov, V.N. Petrov. – 3rd ed. – St.Petersburg: Piter, 2011. – 539 P. (In Russian)
- Kostkina, O.S. Information system of support of decision making while monitoring people's state of health within production: abstract of Ph.D. thesis. –Tver, 2007. – 19 P. (In Russian)
- Mal'chuk, E.V. HTML and CSS / E.V. Mal'chuk. – Moscow: Williams. 2006. – 416 P. (In Russian)
- Pirogov, V.Yu. Information systems and databases: organization and design / E.V. Mal'chuk. – St.Petersburg: BVH-Peterburg. 2009. – 528 P. (In Russian)
- Podol'naya, M.A. Characteristics of design of medical diagnostic systems / M.A. Podol'naya, L.N. Taperova // Informatsionnye tekhnologii v zdravookhranenii. – 2002. – № 8–10. – P.10–11. (In Russian)
- http://www.csep.ca/english/view.asp?x=804 – Canadian guide on physical activity. (In Russian)
Author’s contacts: tatyana.kovalenko@volsu.ru


 Журнал "THEORY AND PRACTICE